 How to Turn Any Visual Into a Compelling Voiceover Script
Edward Tufte, the godfather of data visualization, famously said, "There are two goals when presenting data: convey your story and establish credibility." For decades, professionals have excelled at the first part, creating brilliant, complex, and insightful visuals—flowcharts, architectural diagrams, market trend analyses, and scientific charts. But they have consistently failed at the second.
The moment they have to explain that brilliant visual to a non-expert, they hit a wall. It's the "Visual Translation Gap"—the immense difficulty of converting complex spatial and graphical information into clear, linear, spoken language. It’s the engineer trying to explain a system diagram to the marketing team. It’s the art historian trying to convey the emotional impact of a brushstroke. It's a task so difficult and time-consuming that it often gets skipped, leaving the visual's true value locked away.
According to research, the human brain can process images 60,000 times faster than text. Yet, to share the meaning of that image, we are forced back to the slow, laborious process of writing.
Until now. A new class of AI is emerging that does more than just see; it understands. Image-to-Script AI is a technology that can analyze the content of any image—from a technical diagram to a historical painting—and generate a structured, descriptive, voice-ready script to explain it. This isn't just a party trick; it's a quantum leap in accessibility and communication.
This report is a deep dive into this transformative technology. We'll dissect how it works, showcase real-world strategies for business and education, and provide a step-by-step guide to turning your most complex visuals into your clearest stories.
What is Image-to-Script AI? (It's Not Your Phone's OCR)
It's crucial to understand that this is not the simple Optical Character Recognition (OCR) that pulls text from a photo of a business card. Image-to-Script AI is a sophisticated two-part system:
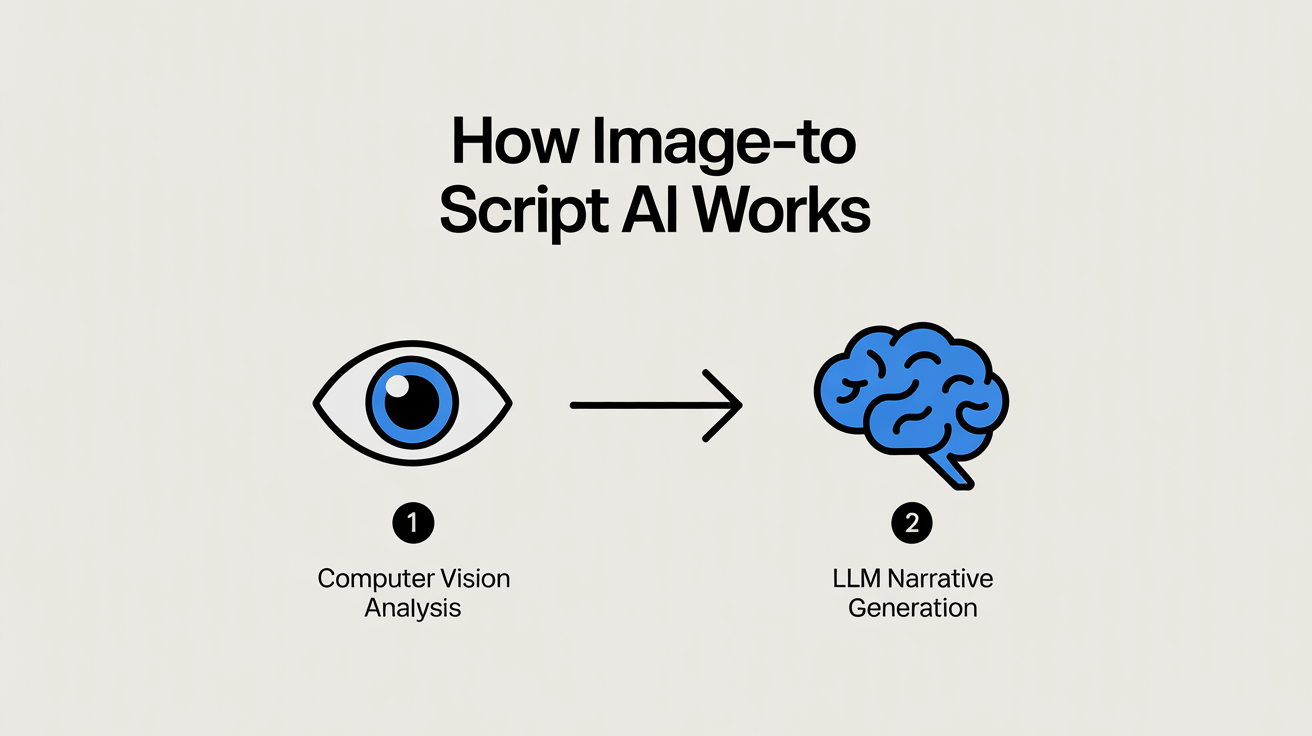 A 2-step flowchart showing the Image-to-Script process
- Computer Vision: A deep learning model analyzes the image, identifying objects, relationships, patterns, and even stylistic elements. It deconstructs the visual into a set of conceptual data points. (e.g., "This is a flowchart. Box A connects to Box B and C. The arrow is red, indicating a critical path.")
- Large Language Model (LLM): This conceptual data is then fed to a specialized, voice-first LLM, like the one powering Kukarella's AI Assistant. The LLM takes the visual data and, guided by your prompt, weaves it into a human-like narrative.
The magic is that the AI isn't just describing what it sees; it's interpreting the meaning in the context you provide.
The Tool Ecosystem for Visual Interpretation
| Tool | Primary Focus | Key Differentiator | Best For |
| Kukarella | Integrated Audio Workflow | "Image-to-Voiced-Narrative." The only tool that integrates visual analysis directly into a script editor and professional voiceover studio. | Creators, educators, and marketers who need a complete, seamless "visual-to-finished-audio" workflow. |
| Google Gemini | Multi-Modal AI Chat | Real-World Knowledge. Can identify landmarks, art, and products in an image and provide factual information from Google Search. | Researchers and individuals who need to identify and learn more about the real-world objects within an image. |
| ChatGPT-5 | Multi-Modal AI Chat | Creative Generation. Excels at generating highly stylized, creative text (poems, stories, etc.) based on a visual prompt. | Writers, artists, and creatives who need a powerful brainstorming partner to generate fictional narratives from an image. |
| Claude 4 | Multi-Modal AI Chat | Dense Data Analysis. Best-in-class at analyzing complex, information-rich visuals like technical diagrams, financial charts, and scientific graphs. | Business analysts, scientists, and technical writers who need to extract and explain complex data from visuals. |
The Visual Playbook: 4 High-Impact Strategies
Here are four real-world scenarios showing the exact prompts that unlock this technology's potential.
Strategy 1: The Business Strategist (De-Jargoning the Flowchart)
Your goal is to explain a complex business process to a new client or a non-technical stakeholder without their eyes glazing over.
- The Visual: A detailed process flowchart for a new software integration.
- The AI Workflow:
- Upload the flowchart image to Kukarella's "Image to Story" feature.
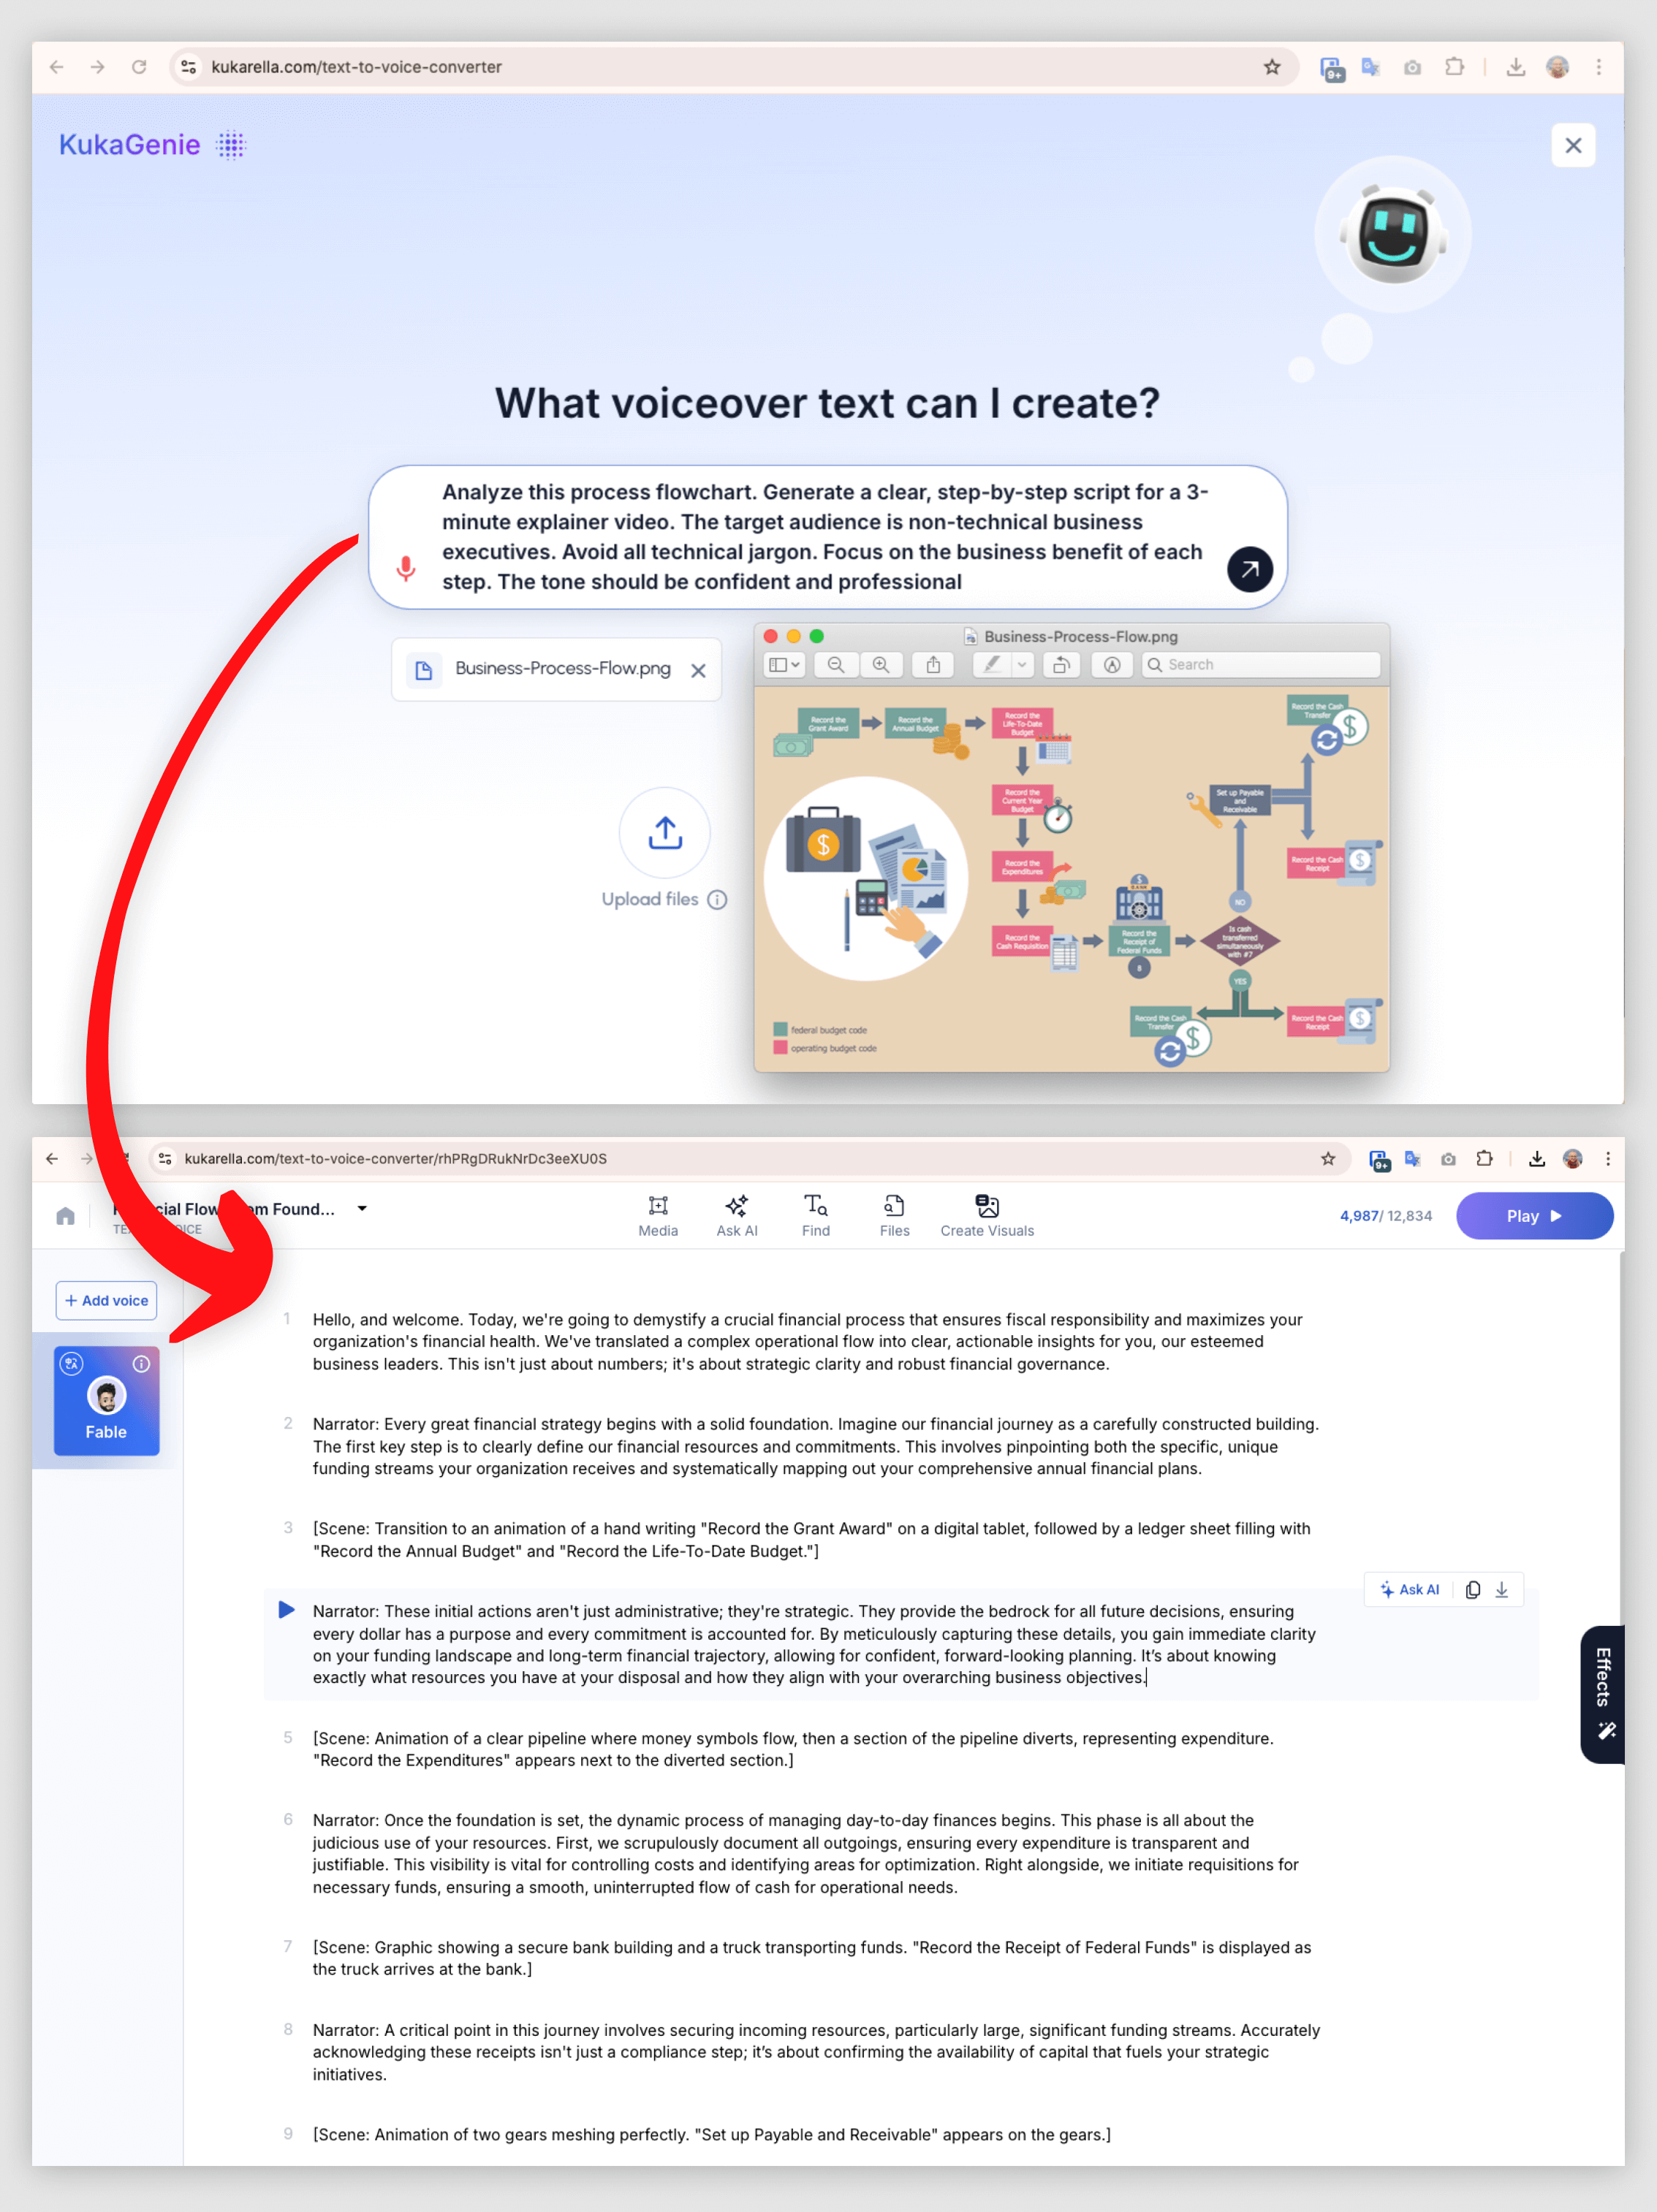
- The Prompt:"Analyze this process flowchart. Generate a clear, step-by-step script for a 3-minute explainer video. The target audience is non-technical business executives. Avoid all technical jargon. Focus on the business benefit of each step. The tone should be confident and professional."
- The Result: The AI doesn't just say "Step 1 connects to Step 2." It translates the technical process into a value-driven narrative.
 Screenshot of Kukarella's Image to Story feature transforming a complex business flowchart into a script
Strategy 2: The Art Historian (Giving a Painting a Voice)
Your goal is to create an engaging audio guide for a museum exhibit that goes beyond simple facts.
- The Visual: Johannes Vermeer (1665) masterpiece "Girl with a Pearl Earring"
- The AI Workflow:
- Upload a high-resolution image of the painting.
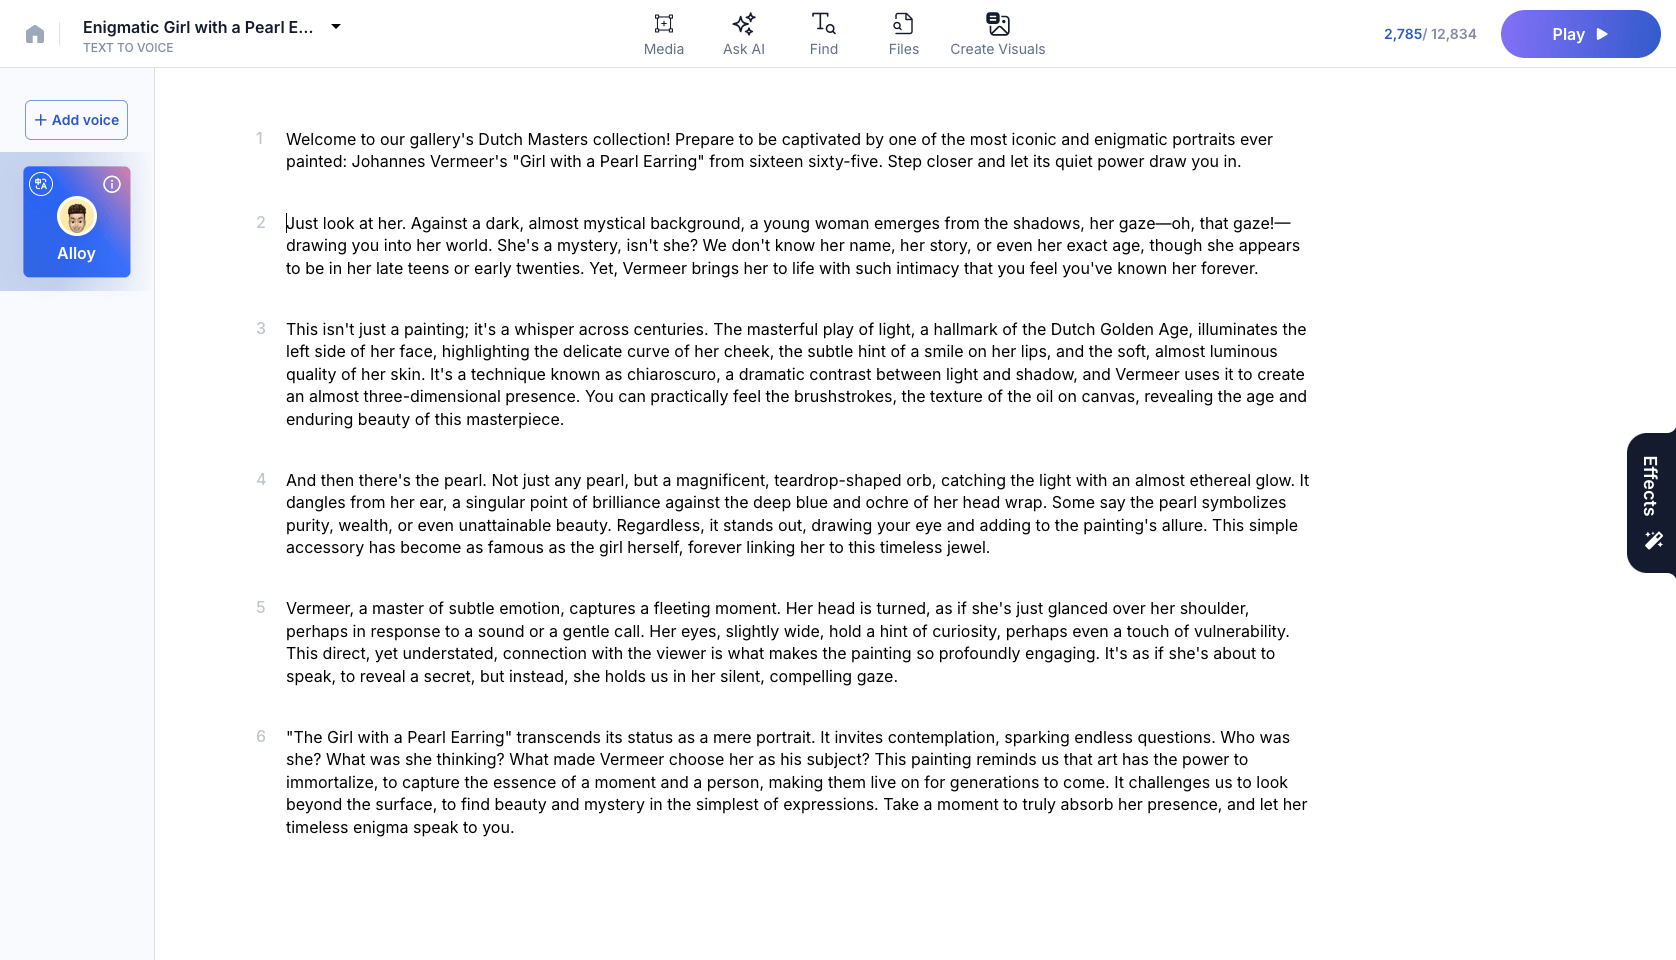
- The Prompt:"Generate a 3-minute descriptive narration script for a museum audio guide about this painting, Johannes Vermeer (1665) masterpiece "Girl with a Pearl Earring". The tone should be that of an expert but passionate art historian. Don't just list facts. Describe the use of light and shadow, the emotional expressions on the students' faces, and the historical context."
- The Result: The AI crafts a rich, atmospheric script: "...This isn't just a painting; it's a whisper across centuries. The masterful play of light, a hallmark of the Dutch Golden Age, illuminates the left side of her face, highlighting the delicate curve of her cheek, the subtle hint of a smile on her lips, and the soft, almost luminous quality of her skin. It's a technique known as chiaroscuro, a dramatic contrast between light and shadow, and Vermeer uses it to create an almost three-dimensional presence. You can practically feel the brushstrokes, the texture of the oil on canvas, revealing the age and enduring beauty of this masterpiece...."
Strategy 3: The Technical Writer (Instant Software Documentation)
Your goal is to create a quick, clear guide for a new software feature.
- The Visual: A screenshot of a complex user interface with several buttons and menus.
- The AI Workflow:
- Upload the screenshot.
- The Prompt:"This is a screenshot of our new 'Advanced Reporting' dashboard. Write a clear, step-by-step voiceover script explaining how a user can create a new report. First, explain the function of the 'Date Range' selector on the top left. Second, describe how to add metrics using the main panel. Third, explain how to save the report using the button in the top right. Keep the instructions concise and action-oriented."
- The Result: A perfect, ready-to-record script for a tutorial or knowledge base video, created in seconds, saving the technical writer hours of tedious work.
Strategy 4: The Science Educator (Making the Invisible Visible)
Your goal is to explain a complex scientific diagram to middle school students.
- The Visual: A diagram of the human circulatory system.
- The AI Workflow:
- Upload the diagram.
- The Prompt:"Explain this diagram of the human circulatory system for a 7th-grade science class. Use an analogy to make it easy to understand, like a superhighway for the body. Personify the red blood cells as delivery trucks. The tone should be exciting and full of wonder."
- The Result: The AI transforms a static, intimidating diagram into a dynamic story of "delivery trucks" picking up oxygen in the lungs and racing to deliver it to the muscles, a far more memorable and effective teaching tool.
"Plot Twist" Moment: The AI Is Your Co-Analyst
The most advanced users of this technology don't just use it for description. They use it for discovery. The AI's computer vision model is trained on millions of images and can sometimes spot patterns or details that a human observer, even an expert, might miss.

The Twist: After generating a base description, you can use follow-up prompts to "interrogate" the image.
- The Visual: A complex stock market chart showing a company's performance over five years.
- Initial Prompt:"Describe the overall trend of this stock chart."
- Follow-up Prompt #1:"Based on the visual data, what was the period of highest volatility?"
- Follow-up Prompt #2:"Are there any recognizable technical patterns in this chart, like a 'head and shoulders' or a 'golden cross'?"
- Follow-up Prompt #3:"Write a short script where two financial analysts debate the cause of the sharp dip seen in Q3 of the second year."
This elevates the tool from a simple describer to a collaborative analysis partner, helping you see your own visual data in a new light.
Implementation Guide: Your First Image-to-Script in 5 Minutes
- Step 1: Choose Your Image. Pick a clear, high-resolution image. For your first try, a simple flowchart or a well-known piece of art works best.
- Step 2: Navigate to the Feature. In Kukarella, find the "Image to Story" feature. This can often be accessed via the AI Assistant in a project.
- Step 3: Upload and Write Your "Director's" Prompt. Upload the image. Write a specific prompt that defines your audience, tone, and what you want the AI to focus on.
(Screenshot showing the Kukarella interface with an image uploaded and a detailed prompt written in the text box) - Step 4: Generate and Refine. Generate the script. Read the output. Is it too technical? Too simple? Use the "Ask AI" refinement tool to make adjustments: "Rewrite this to be simpler, for a 5th-grade audience."
- Step 5: Add a Voice. Once the script is perfect, use a high-quality AI voice or your own clone to generate the final audio narration.
Troubleshooting & The Fine Print
Q: "The script was too generic and missed the most important part of my diagram."
A: Your prompt was likely too vague. The AI doesn't know what you think is important unless you tell it. Be specific. Instead of "Explain this diagram", try "Explain this diagram, paying special attention to the feedback loop between Step 4 and Step 2, as this is the most critical part of the process."
Q: "Can I upload a confidential or proprietary diagram?"
A: This is a critical security question. You must only use a platform that guarantees in its privacy policy that your data (including uploaded images) is not used to train its public AI models. For any business-sensitive visual, using a privacy-first, professional platform like Kukarella is non-negotiable.
Q: "What about very low-quality or blurry images?"
A: Garbage in, garbage out. The AI's computer vision model needs a clear image to work effectively. A blurry, low-resolution image will lead to a generic or inaccurate script. Always use the highest quality source visual you have available.
The ability to translate complex visuals into clear, spoken narratives is a superpower. It bridges knowledge gaps, enhances accessibility, and saves countless hours of creative labor. The visual world is full of stories waiting to be told; you now have the tool to tell them.